IMD business school for management and leadership courses


Future Readiness Indicator
The auto industry: struggling to reimagine its future
To determine this ranking, we measured seven factors:
- Financial performance – you can’t invest in the future if your current business has already collapsed.
- Business diversity in terms of geographic spread.
- Employee diversity, as well as that of leadership teams – diversity of thought is crucial to reinvention.
- Research and development intensity – reinvention requires money and resources.
- The early results of these companies’ innovation efforts.
- Cash generation capability as well as their debt situation.
- Stock market performance, as an indicator of investor confidence.
We tracked these seven key factors using 29 separate indicators, each carrying the same weight in the overall composite score. You can read about our methodology here.
It’s hard stay on top. Just because a car company has a good year doesn’t mean they can relax. Let’s look at the historical trends of four major players.
How today’s winners can win tomorrow
Electronic components will soon make up half the cost to produce a car. Close to 50% of car recalls by manufacturers are not due to mechanical errors, but to electronic failures. Cars are already supercomputers on wheels.
Yet, if you look under the hood, the way a car is assembled is antiquated at best. The electrical and electronic architecture is a patchwork of modern requirements, stitched together as things evolve. It includes the subsystem of the power train and the chassis. Then there are the advanced driver assistance systems and safety. Infotainment, climate control, and connectivity have been added over time.
This is not an architecture optimized for future features, but the result of historic happenstance. That means traditional carmakers will only succeed if they overhaul how a car is built.
This brings us to Tesla. Contrary to how almost everyone else builds cars, Tesla splits the overall architecture differently. It optimizes always-on connectivity. There are four controlled domains: the autopilot; the central information displays; the instrument clusters; and the drivetrain and energy storage. They are prioritized for digital and electric technologies, allowing for over-the-air software updates, and enabling remote access and autonomous driving. This design is also optimized for data collection and algorithm testing, making software deployment easier.
Tesla’s are the car features of the future; they will enable interaction with traffic infrastructure and make wireless communication with other vehicles possible.
Discover more on how Nio and BYD could be the next Tesla.
Still, this doesn’t mean traditional carmakers can’t win. They just need to learn a great deal, quickly.
This is a simple conclusion, but a difficult challenge. The auto industry is a conservative industry, filled with managers with similar backgrounds and not much used to exploration and experimentation.
Why are carmakers finding it so tough?
Traditional carmakers must explore a new space in order to learn. Developing a software system to control all the infotainment can’t be done right the first time; it requires learning. Once they have learned enough, they can start exploiting their newly acquired capabilities. The X-axis in the graph below depicts this.
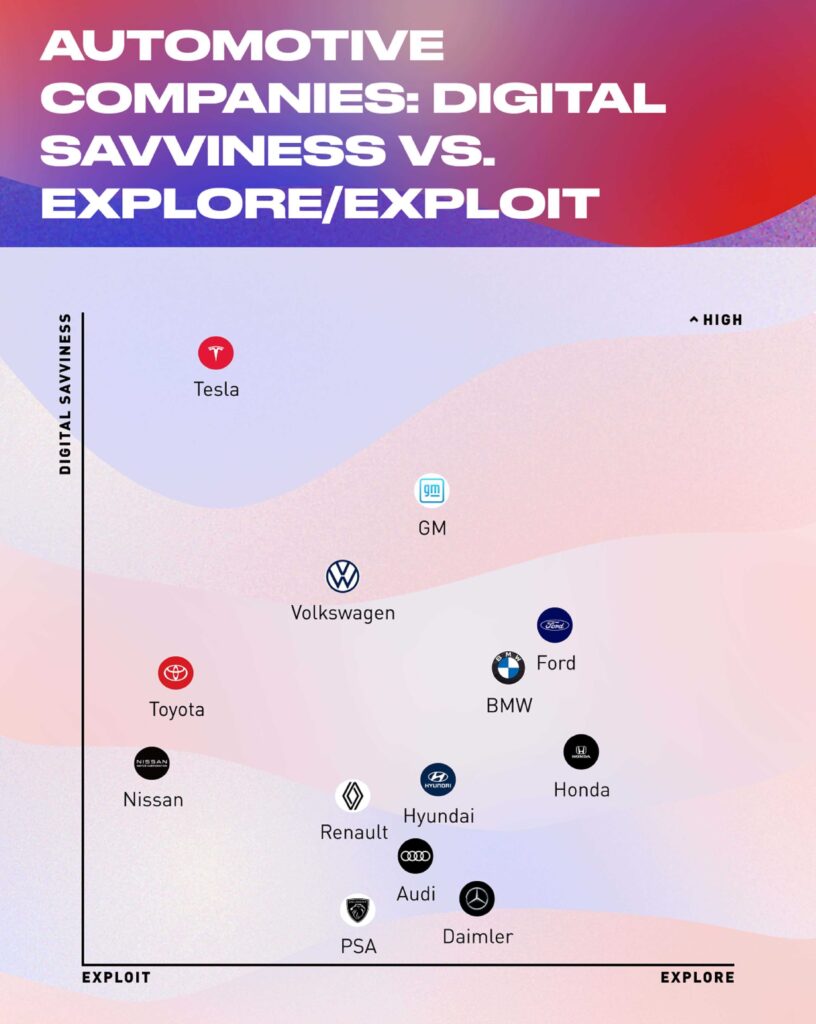
What sets Tesla further apart is that Elon Musk is taking advantage of its current capabilities; the ones its competitors are still learning Given all those pressures, it’s little wonder that the automotive industry is not optimistic: it faces too much disruption. All that electrification and connectivity are sending manufacturers scrambling.
Our final chart below describes how tough it is to be an automotive executive these days. They are in the middle of transformation and being forced to reinvent. Their companies’ futures are uncertain, and they feel a sense of urgency and fear.
The chart shows the average position of different industries, with automotive the least optimistic. And again, Tesla is the ultimate outlier.
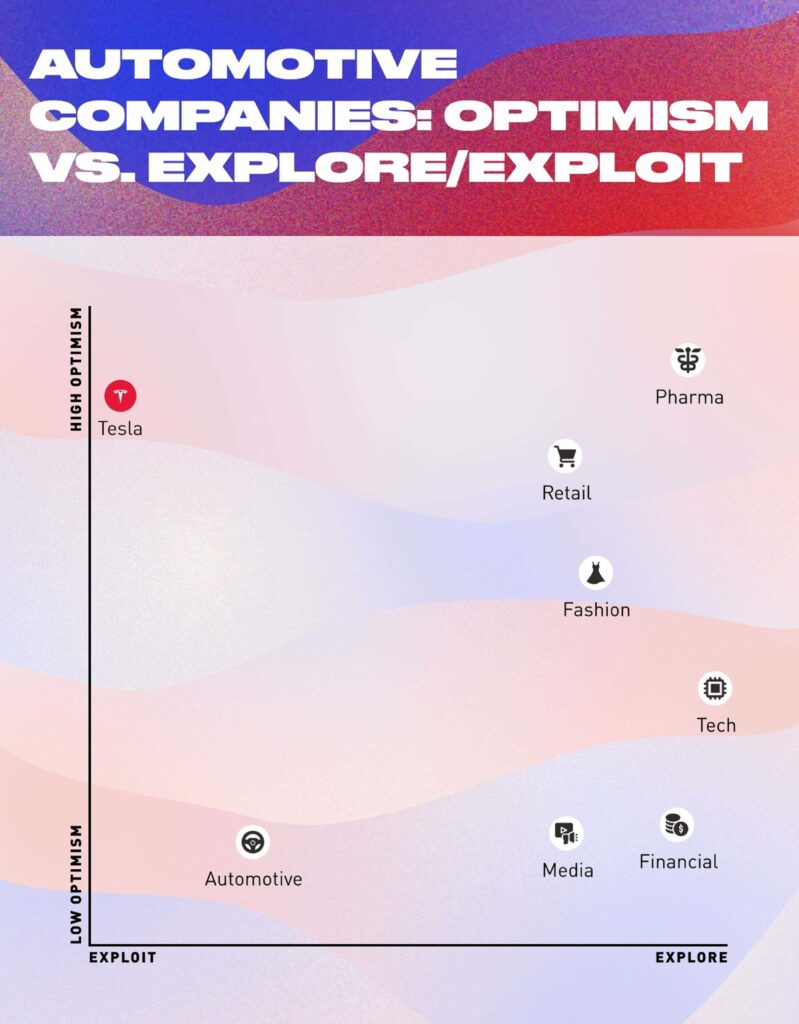
We drew up these charts using big data analytics and feeding 10 years of data from all major business publications into an algorithm. If you are curious about our approach to this research, check it out here.
Want to read more about the semiconductor shortages?
Here’s one graph that shows why every carmaker is getting caught up by surprise.

