IMD business school for management and leadership courses


Our carbon strategy and footprint
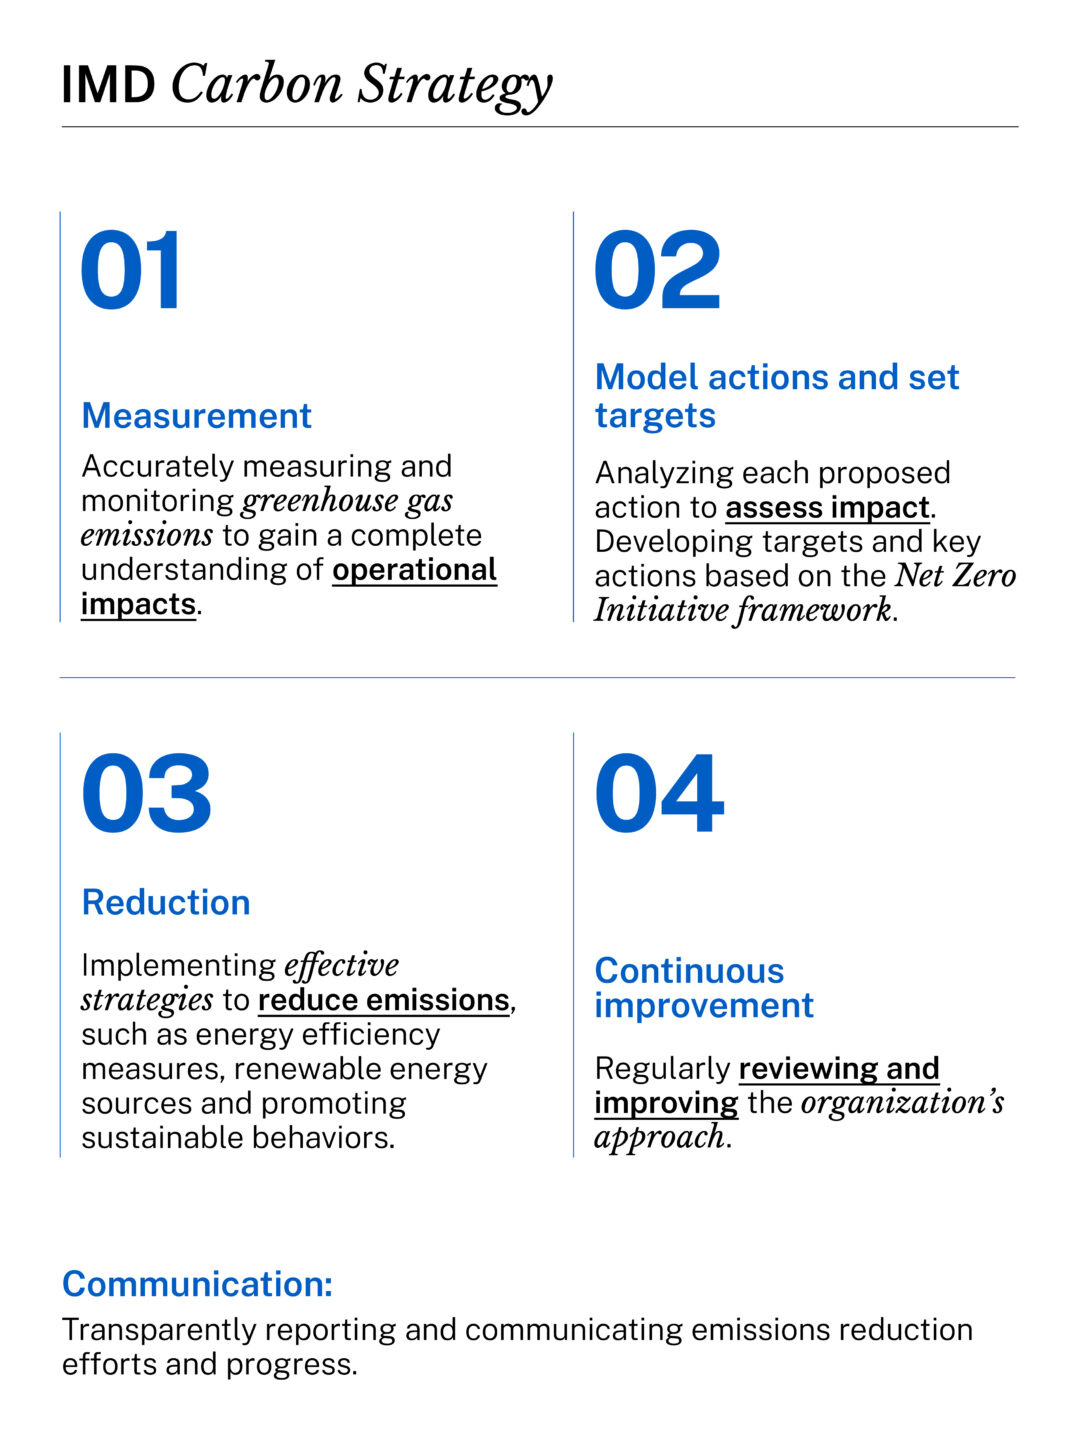
In 2023, IMD developed a carbon strategy to reduce emissions and enforce our commitment to the Sustainable Development Goals (SDGs). Our strategy consists of several steps informed by key standard-setting frameworks, including the GHG Protocol Corporate Standards, Science-Based Targets (SBTi), and the Net Zero Initiative. As part of our commitment, we report on our progress towards reducing our emissions. This section of the report outlines our progress.
Understanding our carbon footprint is critical to informing our strategy; as such, we proactively measure and monitor our greenhouse gas emissions to fully comprehend our operational impact. We are committed to reducing our emissions and are implementing effective strategies to achieve this. These include our investments in energy efficiency measures, utilizing renewable energy sources, and promoting sustainable behavior to reduce our environmental impact. We regularly review and ameliorate our approach as part of our commitment to continuous improvement.
After completing a comprehensive audit of our carbon emissions based on the GHG Protocol in 2022, we set SBTi-informed reduction targets for 2030. The GHG Protocol is an internationally accepted method for companies to measure, manage, and report their greenhouse gas emissions. The audit, which measured our first carbon footprint based on IMD’s 2021 emissions, encompassed Scope 1, 2, and 3 emissions.
In 2023, we established a Green Council to oversee our impact reduction targets and ensure that high-impact and signaling actions are facilitated and implemented. The council members consist of cross-functional senior representatives to ensure that all parts of the organization take responsibility for sustainability efforts.


Impact reduction targets 2030
Impact reduction targets 2030
Scope 1 & 2
Absolute reduction from the 2021 baseline
Scope 1 & 2
Absolute reduction from the 2021 baseline
Scope 3
Economic intensity reduction from the 2021 baseline
Scope 3
Economic intensity reduction from the 2021 baseline
Our carbon footprint
With the expertise and support of a specialized consulting firm, we perform an annual carbon footprint assessment. During this assessment, we analyze all aspects of IMD’s operations. We also engage a wide range of key stakeholders to ensure our measurements are thorough.
The measurement includes Scope 1, 2 and 3 emissions for 2023. The methodology conforms with the World Resource Institute’s Greenhouse Gas Protocol, the global standard for companies and organizations to measure and manage their GHG emissions.
It also complies with the World Business Council for Sustainable Development (WBCSD) and ISO 14064 standards.
In 2023, the emissions related to IMD activities totaled 3,225 metric tons of CO₂, of which 87% were derived from Scope 3 emissions.
Carbon footprint 2023
Carbon footprint 2023
tCO₂ eq
Scope 1
tCO₂ eq
Scope 2
tCO₂ eq
Scope 1
tCO₂ eq
Scope 2
tCO₂ eq
Scope 3
tCO₂ eq
Total
tCO₂ eq
Scope 3
tCO₂ eq
Total
Scope 1 and Scope 2 emissions
In 2023, our Scope 1 and Scope 2 CO₂ emissions totaled 426 tons, down from 522 tons in 2022. According to the GHG protocol, the reporting company should report location and market-based values for Scope 2. For IMD, the 2023 values are 602t CO₂ eq (2022: 697t) and 140t CO₂ eq (2022: 239t), respectively. Nevertheless, we use a tailored impact factor (hybrid) to better reflect energy production and consumption at our Lausanne campus, as Switzerland is our main campus.
Scope 1 contributions in 2023 did not differ significantly from 2022, resulting in a minimal increase of 0.3 tons of CO₂ emissions.
Scope 3 emissions
Our Scope 3 emissions include purchased goods and services, capital goods, waste generated on-site, employee commuting, business travel, and emissions related to fuels and energy purchased and consumed by IMD. Scope 3 also includes emissions from our Singapore campus, which are considered emissions from upstream leased assets. In 2023, Scope 3 equaled 2,799 tons of CO₂ compared with 2,393 tons CO₂ in 2022, resulting in an increase of 405 tons of CO₂.
For calculating our business travel-related emissions, we included staff travel and mandatory travel that takes place during executive education and degree programs, such as our MBA and EMBA discovery expeditions.
The GHG Protocol considers participant travel to and from program locations to be an optional category, similar to customer travel to and from a store.
Working towards our 2030 impact reduction target
In 2023, we achieved a 19% absolute reduction in Scope 1 and 2 compared to our baseline year measurement. Transitioning from gas to district heating enabled us to significantly reduce the amount of gas needed for heating. Combined with other heating reduction measures, such as lowering temperatures during holiday periods, the contribution of heating to our total Scope 2 emissions decreased to 34% in 2023 (47% in 2022).
Scope 1 and 2, the direct emissions from our operations, is where our efforts to reduce CO2 emissions are most impactful, showing our commitment to meet our impact reduction target for 2030.
Carbon impact evolution
(tCO₂ eq)
Carbon impact evolution
(tCO₂ eq)
Carbon impact evolution
(tCO₂ eq)
Carbon impact evolution (total impact)
(tCO₂ eq)