

China Company Transformation Indicator
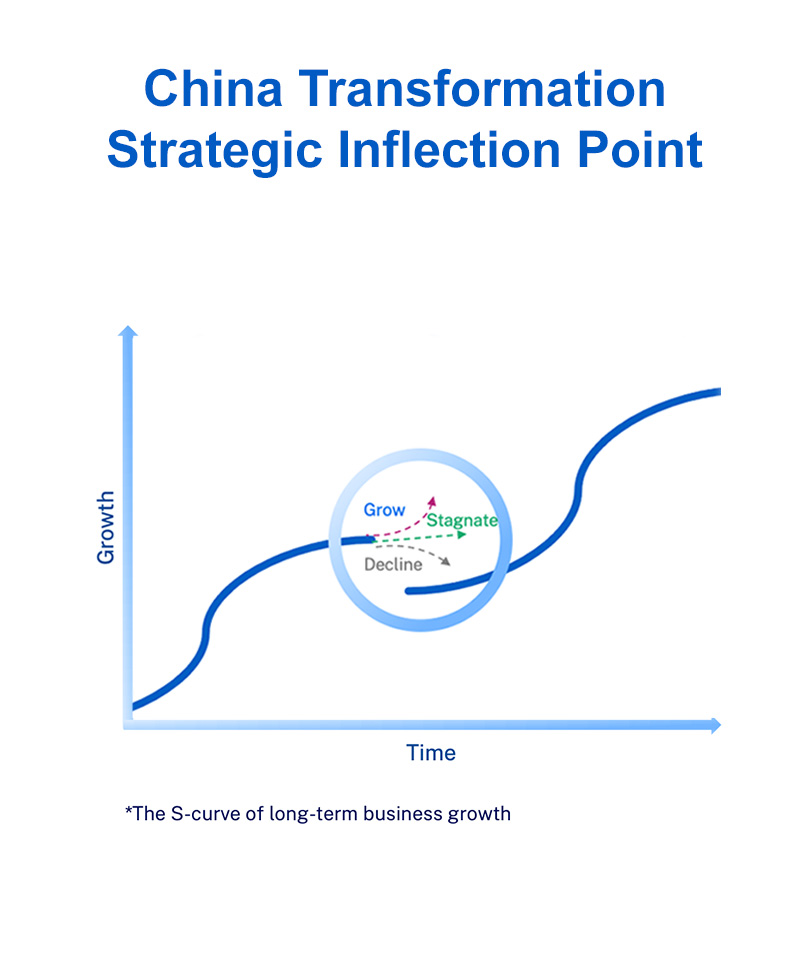
We utilize and enhance the methodology developed by Howard Yu at IMD’s Center for Future Readiness for their Future Readiness Indicator, but localize it to the country level (China) and customize it to different sectors. This includes careful consideration of data sources, verification and triangulation, variable selection, outlier management, and appropriate normalization to ensure the model’s strength and reliability. Additionally, we employ advanced data science tools such as text mining algorithms, factor analysis, and random forest to broaden our data sources and enhance the accuracy of our indicators.
Our China Company Transformation Indicator measures the transformative momentum of leading players by revenue and market capitalization in each industry. The Indicator amalgamates information and data including financial statement analysis, company strategy, innovation initiatives, market circumstances, supply chain links, government associations, media impact, customer relations, social responsibility, environmental protection, and more.
The indicator consists of two pillars – Core Resilience and New Growth Engines – and 10 factors. These factors vary from sector to sector. Take the Food and Beverage industry as an example:
Core Resilience
The main factors vary by sector. In the pharmaceutical industry, for example, the “customer engagement” factor is replaced by the “pharmaceutics pipeline” factor. In the technology industry, we assess the integration of innovative technologies such as edge computing, artificial intelligence, and cloud services.
How we calculate the China Indicator results
Our data resources
Our variables are hard data publicly available on company websites, announcements, annual reports, press releases, news stories, white papers, academic journal articles, and equity research reports.
We consult trustworthy databases like Refinitiv, Pitchbook, Factiva, and more, and utilize local data vendors East Money Choice. Specifically, Refinitiv provides access to company financial data and economic indicators as well as news, analytics, and productivity tools. Pitchbook offers a detailed view of companies, investments, buy-side deals, investors, funds, financials, valuations, and more. Factiva is an archive of over 32,000 major global newspapers, newswires, industry publications, magazines, reports, and other sources.
These sources are also supplemented by administrations including the National IP Administration and National Medical Products Administration. Data extracted from the above databases are cross-checked and calibrated with the data from Statista, Yahoo Finance, Wallmine, Stock.us, Google Finance, HKEXnews, Wind, and so on.
Our statistical method
Upon the collection of company data, we perform pre-processing methods including identifying and removing errors and duplicates, filling the blanks, and processing the outliers. Then we model the distribution of each variable based on their nature and characteristics and perform appropriate standardization.
The standardized data is passed to the indicator calculation operator. Equal weight is assigned to each factor and allocated evenly to inner variables. We compute the indicator based on the sum of weighted standardized data. The company’s overall ranking, together with factor-specific rankings is calculated. Then we plug the results into algorithms designed to analyze their sensitivity, robustness, and validation.
